Updated June 06, 2025
The following table shows the number of homes tested by the UConn team to date. The number of samples include all individual samples from all homes; every home typically has between 3 and 7 samples tested, with the average home having 5 samples. Each sample consists of approximately 150 g of homogenized powder, which is tested for total sulfur, sulfate and sulfide in triplicate (see Our Method). The average of triplicate analyses is then calculated for each sample and reported in the testing report.
| Designation | No of homes | No of samples |
| NN (No damage – No pyrrhotite) | 71 | 306 |
| NP (No damage – Pyrrhotite detected) | 83 | 341 |
| DP (Damage – Pyrrhotite detected) | 102 | 370 |
| TOTAL | 256 | 1017 |
Note: The home description was adopted by the UConn Team and is not related to any official classification for evaluation or prioritization purposes.
For statistical analysis, homes were categorized in three classes:
- NN: Homes with no observable cracks associated with pyrrhotite presence, and for which the measured sulfide concentration was below the quantification limit of the WDXRF method (<0.06% sulfide corresponding to <0.1% pyrrhotite by weight of concrete)
- NP: Homes with no observable cracks associated with pyrrhotite presence, and for which the measured sulfide concentration was above the quantification limit of the WDXRF method
- DP: Homes with observable cracks associated with pyrrhotite presence, and for which the measured sulfide concentration was above the quantification limit of the WDXRF method
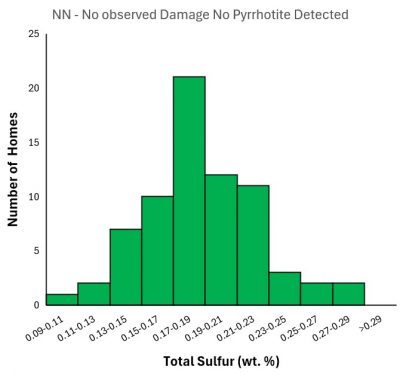
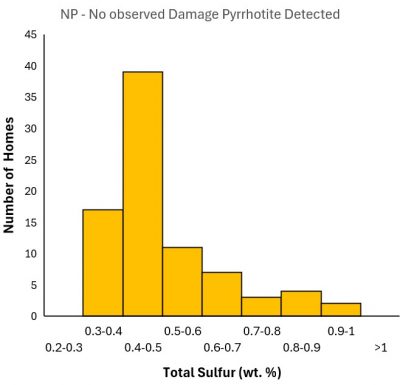
Figure 1 below shows the distribution of total sulfur (ST) by weight percent of concrete for the samples in each home class (NN, NP, DP)
 |
 |
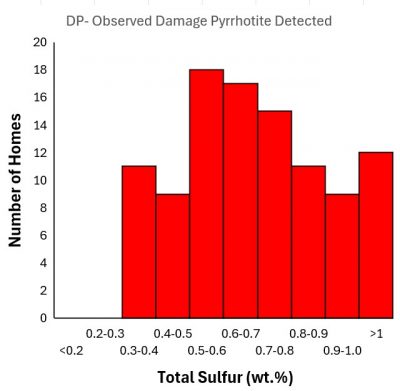 |
| Fig. 1: Distribution of total sulfur (ST) in NN samples, NP samples and DP samples | ||
NN samples with no visible damage and no pyrrhotite had a total sulfur median concentration of 0.17 wt.%, which agrees with the amount of sulfur added through the addition of portland cement to a typical concrete mix. Samples with higher concentrations of total sulfur may have higher content of hydrated cement, or may have trace amounts of other sulfur sources, such as sulfide.
56 out of 83 NP homes with no visible damage and present pyrrhotite had an average total sulfur concentration below 0.5 wt.%. The overall average total sulfur of all NP homes was 0.40 wt%. DP homes with observed damage and present pyrrhotite all had average total sulfur concentrations of at least 0.30 wt.%, with overall average of 0.7 wt.%.
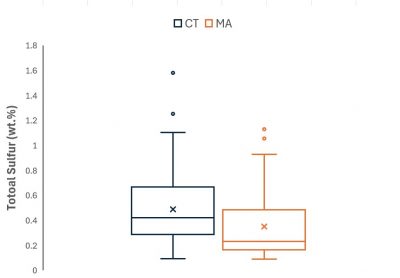
As shown in Figure 2, there was no statistically significant difference in the datasets from homes located in CT versus MA, so that further analysis was conducted for all homes including both states.
 |
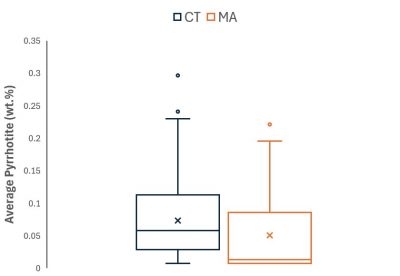 |
| Fig. 2: Distribution of total sulfur (a) | (b) pyrrhotite in CT and MA homes |
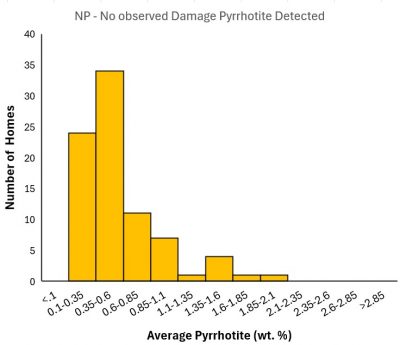
Figure 3 below shows the distribution of the average pyrrhotite concentration calculated on the basis of the amount of sulfide.
 |
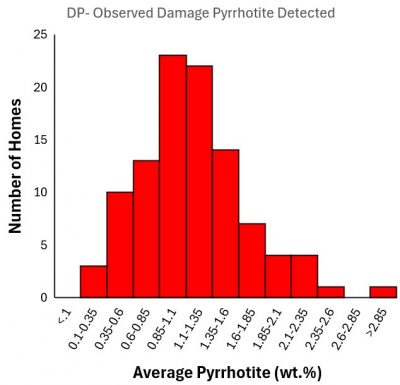 |
| Fig. 3: Distribution of average pyrrhotite (a) in NP homes (no damage) | (b) in DP homes (damage) |
Comparing the NP and DP datasets, the following can be observed:
• The average concentration of pyrrhotite in the NP dataset (0.58 wt.%) is significantly lower than the average (1.17 wt.%) in the DP dataset.
• A few NP homes have high pyrrhotite concentrations, exceeding the average pyrrhotite concentration of DP homes but have no visible damage.
• A considerable number of DP homes have average pyrrhotite concentrations similar to NP homes.
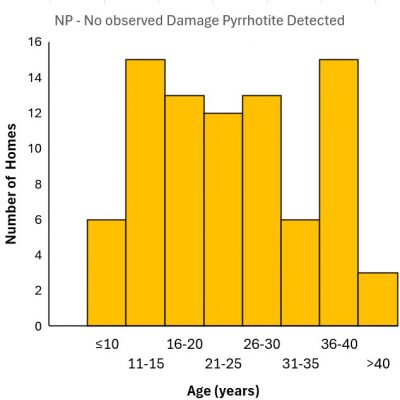
These observations indicate that additional factors beyond the pyrrhotite concentration influence the appearance of damage. The first one to examine is the age of the home, given that pyrrhotite oxidation is a time dependent process. The home age is calculated as the year at the time of sampling minus the year of construction. Figure 4 shows the distribution of home ages tested in the two classes.
 |
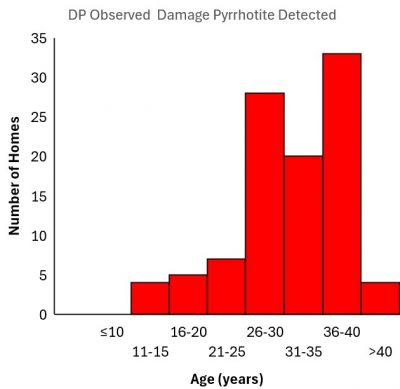 |
| Fig. 4: Distribution of age at the time of samples in NP homes (a) | and DP homes (b) |
The average age of homes with observed damages (DP) was considerable higher (32) compared to the NP homes (25). Only 16 homes showed damage before reaching 25 years of age. NP homes were typically newer, but there was a considerable number of homes exceeding 30 years of age that did not show damage.
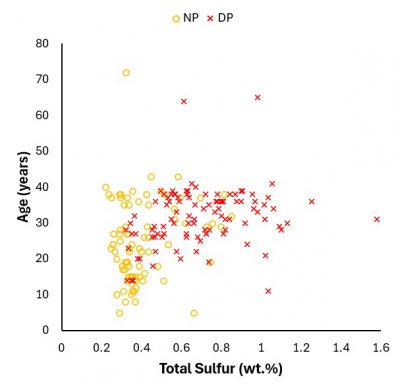
To consider the combined effect of total sulfur and home age, Figure 5 plots these two parameters against each other for the two populations, NP and DP.
 |
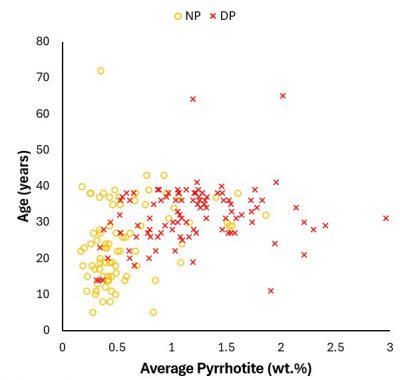 |
| Fig. 5: Total sulfur versus the age (a) | and Pyrrhotite versus the age of individual homes in the NP and DP categories (b) |
Comparing the newer homes (age less or equal to 25 years), it is clear that the total sulfur and pyrrhotite concentrations are generally lower in the homes with no visible damage. Conversely, homes with damage are both older and higher in sulfur, potentially indicating variations in the rock mined during different time periods. Because of this observation, the relative influence of age and total sulfur concentration cannot be determined using this dataset alone. Thus, additional data and evaluations are necessary to accurately predict the risk associated with homes with total sulfur lower than 0.4 wt.%, given that most homes in the field are too young to show observable damage. Ongoing laboratory analyses are conducted to this end.